
Summary: Researchers used data of active COVID-19 case rates from China to set the parameters for the model. Applying the formula to other counties, including the UK, France, and Brazil, they found a match in the evolution of active cases and fatality rates over time.
Source: Santa Fe Institute
As of late May, COVID-19 has killed more than 325,000 people around the world. Even though the worst seems to be over for countries like China and South Korea, public health experts warn that cases and fatalities will continue to surge in many parts of the world. Understanding how the disease evolves can help these countries prepare for an expected uptick in cases.
This week in the journal Frontiers, researchers describe a single function that accurately describes all existing available data on active cases and deaths–and predicts forthcoming peaks. The tool uses q-statistics, a set of functions and probability distributions developed by Constantino Tsallis, a physicist and member of the Santa Fe Institute’s external faculty. Tsallis worked on the new model together with Ugur Tirnakli, a physicist at Ege University, in Turkey.
“The formula works in all the countries in which we have tested,” says Tsallis.
Neither physicist ever set out to model a global pandemic. But Tsallis says that when he saw the shape of published graphs representing China’s daily active cases, he recognized shapes he’d seen before–namely, in graphs he’d helped produce almost two decades ago to describe the behavior of the stock market.
“The shape was exactly the same,” he says. For the financial data, the function described probabilities of stock exchanges; for COVID-19, it described daily the number of active cases–and fatalities–as a function of time.
Modeling financial data and tracking a global pandemic may seem unrelated, but Tsallis says they have one important thing in common. “They’re both complex systems,” he says, “and in complex systems, this happens all the time.” Disparate systems from a variety of fields–biology, network theory, computer science, mathematics–often reveal patterns that follow the same basic shapes and evolution.
The financial graph appeared in a 2004 volume co-edited by Tsallis and the late Nobelist Murray Gell-Mann. Tsallis developed q-statitics, also known as “Tsallis statistics,” in the late 1980s as a generalization of Boltzmann-Gibbs statistics to complex systems.
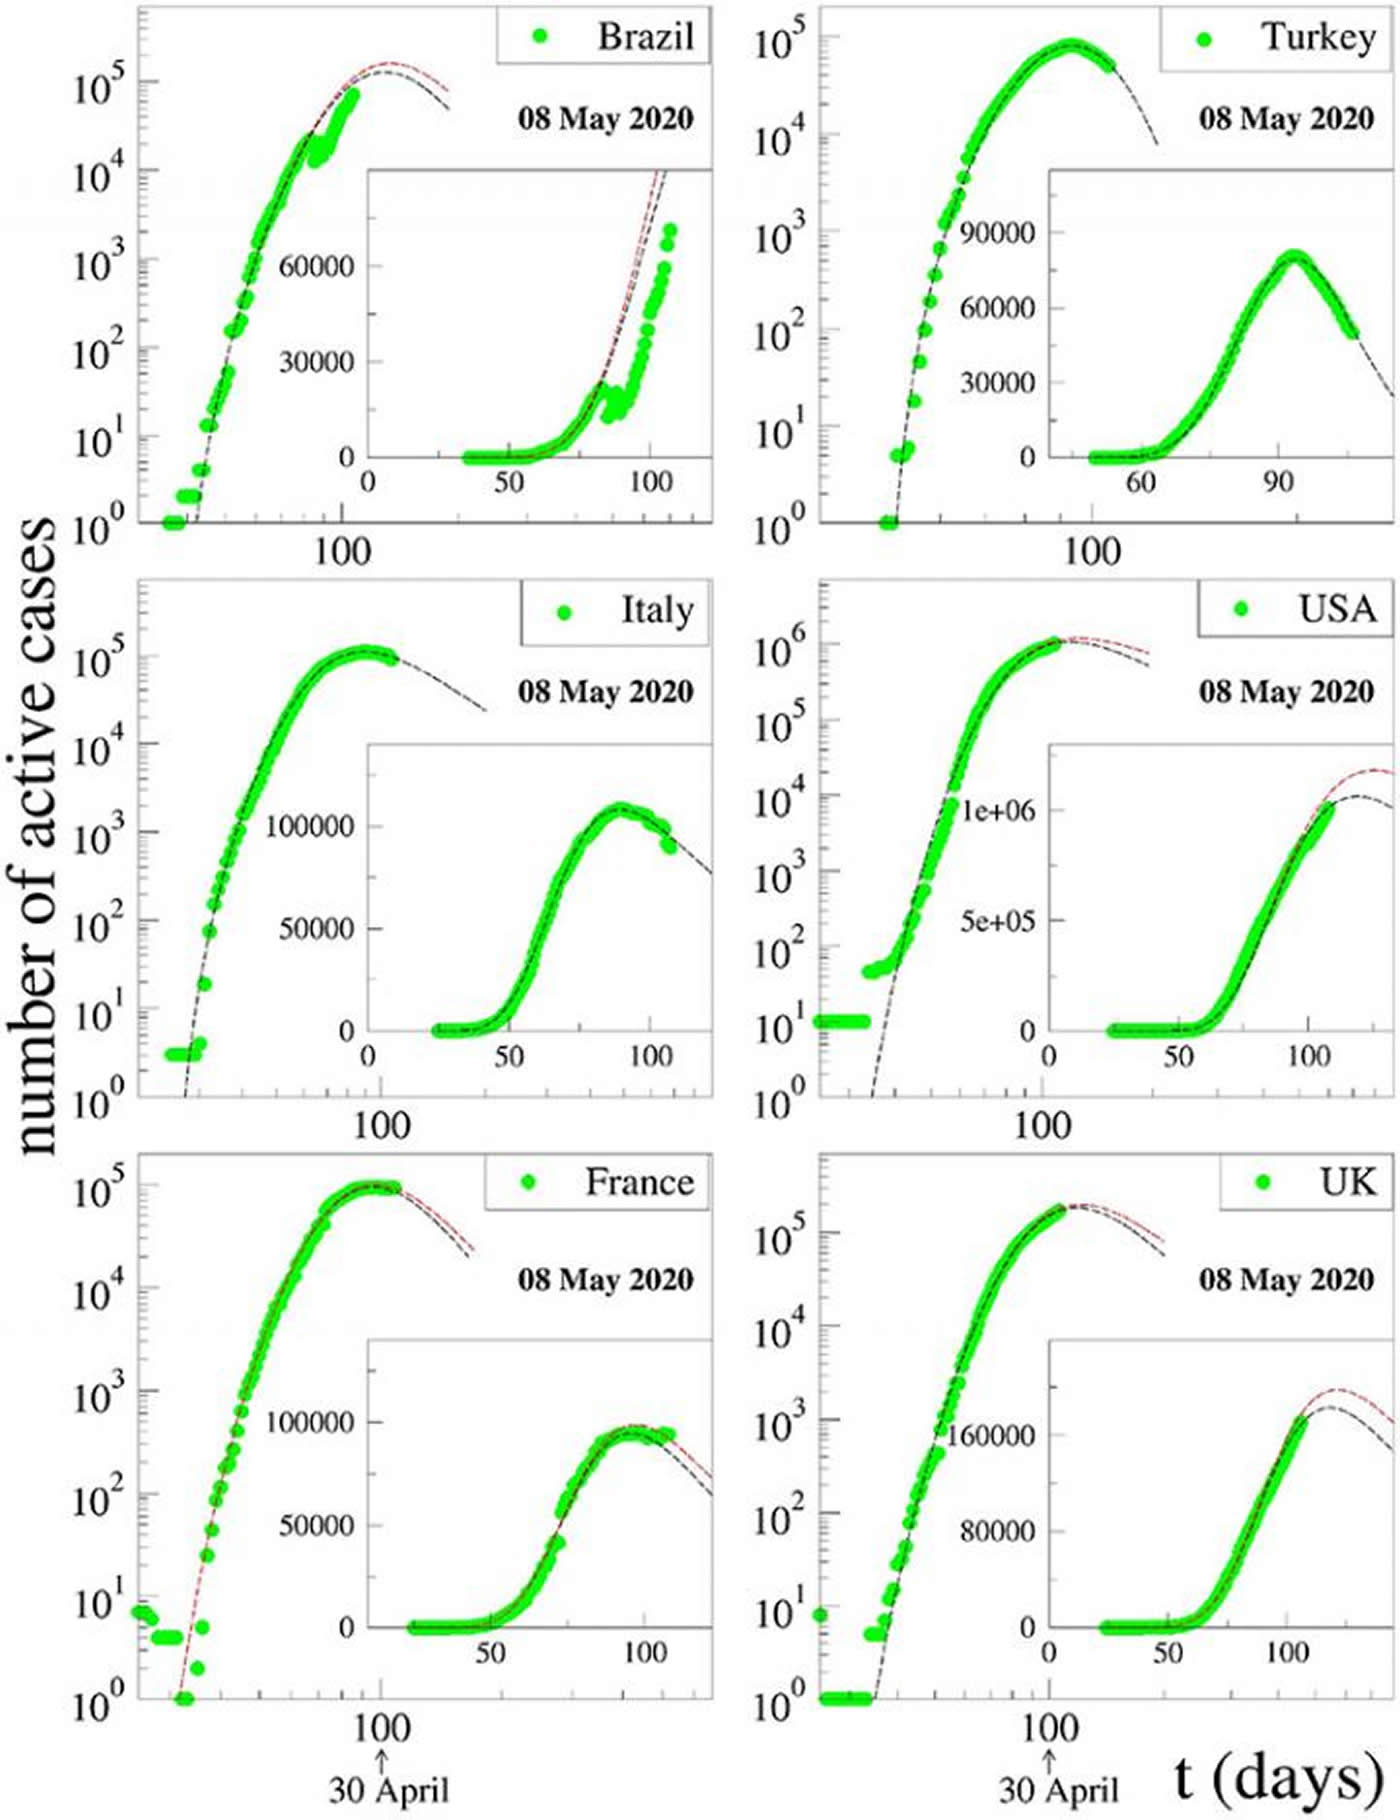
In the new paper, Tsallis and Tirnakli used data from China, where the active case rate is thought to have peaked, to set the main parameters for the formula. Then, they applied it to other countries including France, Brazil, and the United Kingdom, and found that it matched the evolution of the active cases and fatality rates over time.
The model, says Tsallis, could be used to create useful tools like an app that updates in real-time with new available data, and can adjust its predictions accordingly. In addition, he thinks that it could be fine-tuned to fit future outbreaks as well.
“The functional form seems to be universal,” he says, “Not just for this virus, but for the next one that might appear as well.”
About this coronavirus research article
Source:
Santa Fe Institute
Media Contacts:
J Marshall – Santa Fe Institute
Image Source:
The image is credited to Constantino Tsallis and Ugur Tirnakli, Frontiers.
Original Research: Open access
“Predicting COVID-19 Peaks Around the World”. by Constantino Tsallis and Ugur Tirnakli.
Frontiers in Physics doi:10.3389/fphy.2020.00217
Abstract
Predicting COVID-19 Peaks Around the World
The official data for the time evolution of active cases of COVID-19 pandemics around the world are available online. For all countries, a peak has been either observed (China and South Korea) or is expected in the near future. The approximate dates and heights of those peaks have important epidemiological implications. Inspired by similar complex behavior of volumes of transactions of stocks at the NYSE and NASDAQ, we propose a q-statistical functional form that appears to describe satisfactorily the available data for all countries. Consistently, predictions of the dates and heights of those peaks in severely affected countries become possible unless efficient treatments or vaccines, or sensible modifications of the adopted epidemiological strategies, emerge.
Feel Free To Share This COVID-19 News.