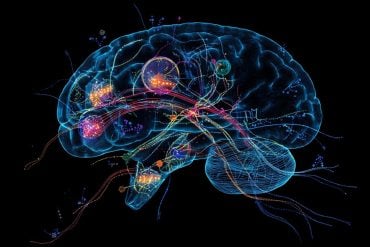
Summary: A new tool is allowing researchers to interactively explore the hierarchical processes that happen in the brain when it is resting or performing tasks.
Source: DOE/Lawrence Berkeley National Laboratory.
New Berkeley Lab tool could shed light on how neurological diseases spread.
Did you know that your brain processes information in a hierarchy? As you are reading this page, the signal coming in through your eyes enters your brain through the thalamus, which organizes it. That information then goes on to the primary visual cortex at the back of the brain, where populations of neurons respond to very specific basic properties. For instance, one set of neurons might fire up because the text on your screen is black and another set might activate because there are vertical lines. This population will then trigger a secondary set of neurons that respond to more complex shapes like circles, and so on until you have a complete picture.
For the first time, a new tool developed at the Department of Energy’s (DOE’s) Lawrence Berkeley National Laboratory (Berkeley Lab) allows researchers to interactively explore the hierarchical processes that happen in the brain when it is resting or performing tasks. Scientists also hope that the tool can shed some light on how neurological diseases like Alzheimer’s spread throughout the brain.
Created in conjunction with computer scientists at University of California, Davis (UC Davis) and with input from neuroscientists at UC San Francisco (UCSF), the software, called Brain Modulyzer, combines multiple coordinated views of functional magnetic resonance imaging (fMRI) data–like heat maps, node link diagrams and anatomical views–to provide context for brain connectivity data.
“The tool provides a novel framework of visualization and new interaction techniques that explore the brain connectivity at various hierarchical levels. This method allows researchers to explore multipart observations that have not been looked at before,” says Sugeerth Murugesan, who co-led the development of Brain Modulyzer. He is currently a graduate student researcher at Berkeley Lab and a PhD candidate at UC Davis.
“Other tools tend to look at abstract or statistical network connections but don’t do quite a good job at connecting back to the anatomy of the brain. We made sure that Brain Modulyzer connects to brain anatomy so that we can simultaneously appreciate the abstract information in anatomical context,” says Jesse Brown, a postdoctoral researcher at UCSF who advised the Berkeley Lab development team on the tool’s functionality.
A paper describing Brain Modulyzer was recently published online in the IEEE/ACM Transactions on Computational Biology and Bioinformatics. Brain Modulyzer is now available on github. Murugesan and Berkeley Lab Computer Scientist Gunther Weber developed the tool together. Weber is also an adjunct professor in the Department of Computer Science at UC Davis. UCSF Associate Professor of Neurology William Seeley also advised the tool’s development.
Predicting Spread of Neurodegenerative Diseases
As a neuroscientist at UCSF’s Memory and Aging Center, Brown and his colleagues use neuroimaging to diagnose diseases, like Alzheimer’s and dementia, as well as monitor how the diseases progress over time. Ultimately, their goal is to build a predictive model of how a disease will spread in the brain based on where it starts.
“We know that the brain is built like a network, with axons at the tip of neurons that project to other neurons. That’s the main way the neurons connect with each other, so one way to think about disease spreading in the brain is that it starts in one place and kind of jumps over along the network connections,” says Brown.
To see how a brain region is connected to other brain regions, Brown and his colleagues examine the fMRIs of healthy subjects. The set of connections observed in the fMRIs are visualized as a network. “For us the connection pattern of the network in healthy subjects is valuable information, because if we then study a patient with dementia and see that the disease is starting at point a in that network, we can expect that it will soon spread through the network connections to points b and c,” Brown adds.
Before Brain Modulyzer, researchers could only explore these neural networks by creating static images of the brain regions they were studying and superimposing those pictures on an anatomical diagram of the entire brain. On the same screen, they’d also look at fMRI data that had been reduced to a static network diagram.
“The problem with this analysis process is that it’s all static. If I wanted to explore another region of the brain, which would be a different pattern, I’d have to input a whole different set of data and create another set of static images,” says Brown.

But with Brain Modulyzer, all he has to do is input a matrix that describes the connection strengths between all of the brain regions that he is interested in studying and the tool will automatically detect the networks. Each network is colored differently in the anatomical view and the information visualized abstractly in a number of graph and matrix views.
“Modulyzer is such a helpful tool for discovery because it bubbles up really important information about functional brain properties, including information that we knew was there before, but it also connects to brain regions that we didn’t realize existed before in the dataset. Every time I use it, I find something surprising in the data,” says Brown. “It is also incredibly valuable for researchers who don’t know these methods as well. It will allow them to be a lot more efficient in detecting connections between brain regions that are important for cognition.”
History and Next Steps
The idea for Brain Modulyzer initiated when Berkeley Lab’s Weber and Seeley met at the “Computational Challenges for Precision Medicine” in November 2012. This workshop brought together investigators from Berkeley and UCSF to focus on computational challenges posed by precision medicine. Their initial discussions led to a collaboration with Oblong Industries–a company that builds computer interfaces–to translate laboratory data collected at UCSF into 3D visualizations of brain structures and activity. The results of this collaboration were presented at the Precision Medicine Summit in May 2013.
To demonstrate Brain Modulyzer’s capabilities, this video shows how scientists are using the tool to explore progressive supranuclear palsy—a brain disorder that affects movement, control of walking (gait) and balance, speech, swallowing, vision, mood, behavior and thinking—as well as memory encoding and retrieval. (Credit: Sugeerth Murugesan, Berkeley Lab / UC Davis)
“At the Aging and Memory Center at UCSF, our expertise is in neuroscience, neurological diseases and dementia. We are really fortunate to be in touch with Berkeley Lab scientists whose expertise in visualization, maps and working with big data exploration helped us build such amazing tools,” says Brown. “The precision medicine collaboration was such a fruitful collaboration for everyone that we decided to stay in touch.”
After the Precision Medicine Summit, the team discussed possibilities for further collaboration, which led to a Laboratory Directed Research and Development (LDRD) project at Berkeley Lab called “Graph-based Analysis and Visualization of Multimodal Multi-resolution Large-scale Neuropathology Data.” Part of the funding for Brain Modulyzer development came from this LDRD, as well as grants to Seeley from the Tau Consortium and National Institutes of Health.
Soon, the team hopes to present their Brain Modulyzer paper to the neuroscience community for feedback. “We want to make sure that this tool is useful to the community, so we will keep iterating on it,” says Brown. “We have plenty of ideas to improve on what we have, and we think that Modulyzer will keep getting better over time.”
In addition to Brown, Weber, Murugesan and Seeley other authors on the paper are Bernd Hamann (UC Davis), Andrew Trujillo (UCSF) and Kristopher Bouchard (Berkeley Lab).
Source: Linda Vu – DOE/Lawrence Berkeley National Laboratory
Image Source: NeuroscienceNews.com image credited to Sugeerth Murugesan, Berkeley Lab/UC Davis.
Video Source: The video is credited to Sugeerth Murugesan, Berkeley Lab / UC Davis.
Original Research: Abstract for “Brain Modulyzer: Interactive Visual Analysis of Functional Brain Connectivity” by Sugeerth Murugesan; Kristofer Bouchard; Jesse A. Brown; Bernd Hamann; William W. Seeley; Andrew Trujillo; and Gunther H. Weber in IEEE/ACM Transactions on Computational Biology and Bioinformatics. Published online October 2016 doi:10.1109/TCBB.2016.2564970
[cbtabs][cbtab title=”MLA”]DOE/Lawrence Berkeley National Laboratory. “Brain Modulyzer Provides Interactive Window into the Brain.” NeuroscienceNews. NeuroscienceNews, 10 October 2016.
<https://neurosciencenews.com/brain-modulyzer-neuroscience-5251/>.[/cbtab][cbtab title=”APA”]DOE/Lawrence Berkeley National Laboratory. (2016, October 10). Brain Modulyzer Provides Interactive Window into the Brain. NeuroscienceNews. Retrieved October 10, 2016 from https://neurosciencenews.com/brain-modulyzer-neuroscience-5251/[/cbtab][cbtab title=”Chicago”]DOE/Lawrence Berkeley National Laboratory. “Brain Modulyzer Provides Interactive Window into the Brain.” https://neurosciencenews.com/brain-modulyzer-neuroscience-5251/ (accessed October 10, 2016).[/cbtab][/cbtabs]
Abstract
Brain Modulyzer: Interactive Visual Analysis of Functional Brain Connectivity
We present Brain Modulyzer, an interactive visual exploration tool for functional magnetic resonance imaging (fMRI) brain scans, aimed at analyzing the correlation between different brain regions when resting or when performing mental tasks. Brain Modulyzer combines multiple coordinated views—such as heat maps, node link diagrams and anatomical views—using brushing and linking to provide an anatomical context for brain connectivity data. Integrating methods from graph theory and analysis, e.g., community detection and derived graph measures, makes it possible to explore the modular and hierarchical organization of functional brain networks. Providing immediate feedback by displaying analysis results instantaneously while changing parameters gives neuroscientists a powerful means to comprehend complex brain structure more effectively and efficiently and supports forming hypotheses that can then be validated via statistical analysis. To demonstrate the utility of our tool, we present two case studies—exploring progressive supranuclear palsy, as well as memory encoding and retrieval.
“Brain Modulyzer: Interactive Visual Analysis of Functional Brain Connectivity” by Sugeerth Murugesan; Kristofer Bouchard; Jesse A. Brown; Bernd Hamann; William W. Seeley; Andrew Trujillo; and Gunther H. Weber in IEEE/ACM Transactions on Computational Biology and Bioinformatics. Published online October 2016 doi:10.1109/TCBB.2016.2564970


