Summary: A new system translates EEG data into a 3D movie which shows activity in all recorded regions of the brain. The heat map shows where seizures start and spread throughout the patient’s brain, in addition to evaluating the speed of activity during a seizure.
Source: UCSF
For 29 years, from the time she was 12, Rashetta Higgins had been wracked by epileptic seizures – as many as 10 a week – in her sleep, at school and at work. She lost four jobs over 10 years. One seizure brought her down as she was climbing concrete stairs, leaving a bloody scene and a bad gash near her eye.
A seizure struck in 2005 while she was waiting at the curb for a bus. “I fell down right when the bus was pulling up,” she says. “My friend grabbed me just in time. I fell a lot. I’ve had concussions. I’ve gone unconscious. It has put a lot of wear and tear on my body.”
Then, in 2016, Higgins’ primary-care doctor, Mary Clark, at La Clinica North Vallejo, referred her to UC San Francisco’s Department of Neurology, marking the beginning of her journey back to health and her contribution to new technology that will make it easier to locate seizure activity in the brain. Medication couldn’t slow her seizures or diminish their severity, so the UCSF Epilepsy Center team recommended surgery to first record and pinpoint the location of the bad activity and then remove the brain tissue that was triggering the seizures.
In April, 2019, Higgins was admitted to UCSF’s 10-bed Epilepsy Monitoring Unit at UCSF Helen Diller Medical Center at Parnassus Heights, where surgeons implanted more than 150 electrodes. EEGs tracked her brain wave activity around the clock to pinpoint the region of tissue that had triggered her brainstorms for 29 years.
In just one week, Higgins had 10 seizures, and each time, the gently undulating EEG tracings recording normal brain activity jerked suddenly into the tell-tale jagged peaks and valleys indicating a seizure.
To find the site of a seizure in a patient’s brain, experts currently look at brain waves by reviewing hundreds of squiggly lines on a screen, watching how high and low the peaks and valleys go (the amplitude) and how fast these patterns repeat or oscillate (the frequency). But during a seizure, electrical activity in the brain spikes so fast that the many EEG traces can be tough to read.
“We look for the electrodes with the largest change,” says Robert Knowlton, MD, professor of Neurology, the medical director of the UCSF Seizure Disorders Surgery Program and a member of the UCSF Weill Institute of Neurosciences. “Higher frequencies are weighted more. They usually have the lowest amplitude, so we look on the EEG for a combination of the two extremes. It’s visual – not completely quantitative. It’s complicated to put together.”
Measuring the Lines
Enter Jonathan Kleen, MD, PhD, assistant professor of Neurology and a member of the UCSF Weill Institute of Neurosciences. Trained as both a neuroscientist and a computer scientist, he quickly saw the potential of a software strategy to clear up the picture – literally.
“The field of information visualization has really matured in the last 20 years,” Kleen said. “It’s a process of taking huge volumes of data with many details – space, time, frequency, intensity and other things – and distilling them into a single intuitive visualization like a colorful picture or video.”
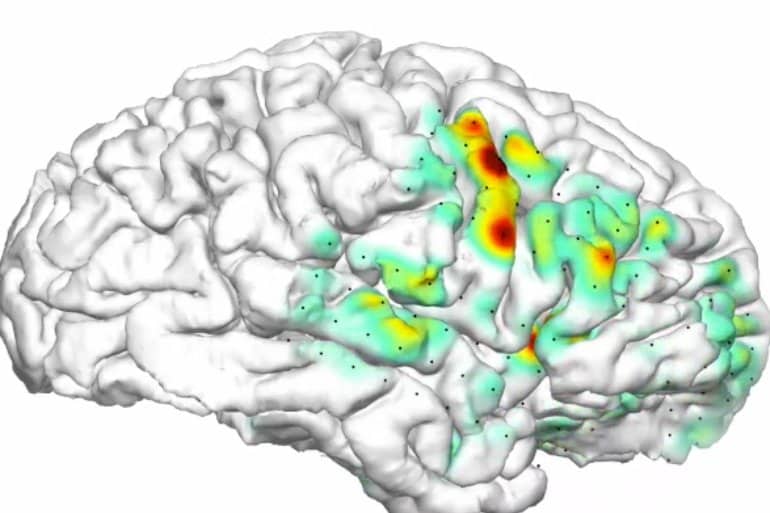
Kleen developed a program that translates the hundreds of EEG traces into a 3-D movie showing activity in all recorded locations in the brain. The result is a multicolored 3-D heat map that looks very much like a meteorologist’s hurricane weather map.
The heat map’s cinematic representation of seizures, projected onto a 3-D reconstruction of the patient’s own brain, helps one plainly see where a seizure starts and track where, and how fast, it spreads through the brain.
The heat map closely aligns with the traditional visual analysis, but it’s simpler to understand and is personalized to the patient’s own brain.
“To see it on the heat map makes it much easier to define where the seizure starts, and whether there’s more than one trigger site,” Knowlton said. “And it is much better at seeing how the seizure spreads. With conventional methods, we have no idea where it’s spreading.”
Researchers are using the new technology at UCSF to gauge how well it pinpoints the brain’s seizure trigger compared with the standard visual approach. So far, the heat maps have been used to help identify the initial seizure site and the spread of a seizure through the brain in more than 115 patients.
Kleen’s strategy is disarmingly simple. To distinguish seizures from normal brain activity, he added up the lengths of the lines on an EEG. Seizures show up as high peaks and low valleys that make their cumulative length quite long, while gently undulating brain waves make much shorter lines. Kleen’s software translated these lengths into different colors, and the visualization was born.

The technology proved pivotal in Higgins’ treatment.
“Before her recordings, we had feared that Rashetta had multiple seizure-generating areas,” Kleen said. “But her video made it plainly obvious that there was a single problem area, and the bad activity was rapidly spreading from that primary hot spot.”
The journal Epilepsia put Kleen’s and Knowlton’s 3-D heat map technology on the cover, and the researchers made their software open-source, so others can improve upon it.
“It’s been a labor of love to get this technology to come to fruition” Kleen said. “I feel very strongly that to make progress in the field we need to share technologies, especially things that will help patients.”
A Fresh Start
Higgins has been captivated by the 3-D heat maps of her brain.
“It was amazing,” she said. “It was like, ‘That’s my brain. I’m watching my brain function.’”
And the surgery has been a life-changing success. Higgins hasn’t had a seizure in more than two years, feels mentally sharp, and is looking for a job.
“When I wake up, I’m right on it every morning,” she said. “I waited for this day for a long, long time.”
About this epilepsy research news
Source: UCSF
Contact: Wallace Ravven – UCSF
Image: The image is in the public domain
Original Research: Closed access.
“Accuracy of omni-planar and surface casting of epileptiform activity for intracranial seizure localization” by Jonathan Kleen et al. Epilepsia
Abstract
Accuracy of omni-planar and surface casting of epileptiform activity for intracranial seizure localization
Objective
Intracranial electroencephalography (ICEEG) recordings are performed for seizure localization in medically refractory epilepsy. Signal quantifications such as frequency power can be projected as heatmaps on personalized three-dimensional (3D) reconstructed cortical surfaces to distill these complex recordings into intuitive cinematic visualizations. However, simultaneously reconciling deep recording locations and reliably tracking evolving ictal patterns remain significant challenges.
Methods
We fused oblique magnetic resonance imaging (MRI) slices along depth probe trajectories with cortical surface reconstructions and projected dynamic heatmaps using a simple mathematical metric of epileptiform activity (line-length). This omni-planar and surface casting of epileptiform activity approach (OPSCEA) thus illustrated seizure onset and spread among both deep and superficial locations simultaneously with minimal need for signal processing supervision. We utilized the approach on 41 patients at our center implanted with grid, strip, and/or depth electrodes for localizing medically refractory seizures. Peri-ictal data were converted into OPSCEA videos with multiple 3D brain views illustrating all electrode locations. Five people of varying expertise in epilepsy (medical student through epilepsy attending level) attempted to localize the seizure-onset zones.
Results
We retrospectively compared this approach with the original ICEEG study reports for validation. Accuracy ranged from 73.2% to 97.6% for complete or overlapping onset lobe(s), respectively, and ~56.1% to 95.1% for the specific focus (or foci). Higher answer certainty for a given case predicted better accuracy, and scorers had similar accuracy across different training levels.
Significance
In an era of increasing stereo-EEG use, cinematic visualizations fusing omni-planar and surface functional projections appear to provide a useful adjunct for interpreting complex intracranial recordings and subsequent surgery planning.