
Brain imaging to measure development of a child’s brain networks may help predict who’s at risk.
Want to know if your child’s height and weight are on track? Check the growth chart that the doctor gives you after each yearly checkup.
Want to know if your child’s brain is on track for healthy attention abilities? Someday, your doctor might have a growth chart for that too.
New research from the University of Michigan Medical School suggests that it might be possible to create a growth chart of brain networks that could identify early signs of attention difficulties and, potentially, attention deficit hyperactivity disorder.
The team created the experimental growth chart by mapping the development of brain networks in more than 500 children and teens. They found networks are underdeveloped in those who have attention difficulties.
While it’s far too soon to start offering such charting to families, future development of the technique could mean better chances for children to get a firm diagnosis of ADHD sooner. It could also help track whether their ADHD treatment is improving their attention functioning, which can help them in school and life.
Growth charts as biomarkers
The research, published in JAMA Psychiatry, shows the potential for brain imaging “biomarkers” for attention problems. But the idea could extend to other psychological conditions.
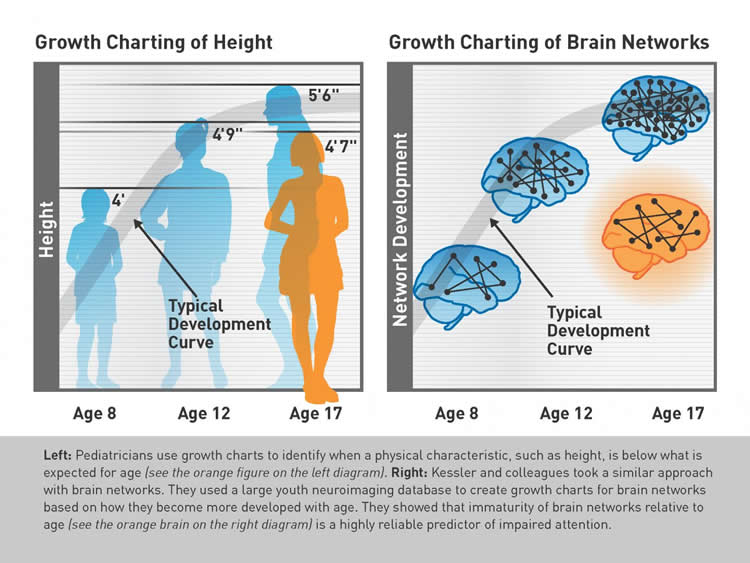
Traditional growth charts show a child’s height and weight as points on curves that are based on data from hundreds of thousands of other children, and indicate normal, near-normal and problematic development.
“Growth charts enable a family and their physician to quickly spot problematic development, and when necessary, intervene appropriately,” said team leader and U-M psychiatrist Chandra Sripada, M.D., Ph.D. “In the future, we want to provide clinicians with the same sort of guidance about brain development that we can about things like height and weight.”
Maturing networks
The researchers launched the growth-charting research after noticing a gap in the state of the science.
Lead author Daniel Kessler explains, “We knew that the ability to sustain attention for an extended time increases dramatically during childhood and adolescence. We also knew that over the same time period, there are big changes in brain networks involved in attention. We came up with the idea of growth charting as a way to test if these two patterns were related: Would children with underdeveloped brain networks also have more difficulty with attention?”
Along with colleague Michael Angstadt, MAS, the researchers used data from 519 children and teens who had genetic testing, brain imaging and tests of their cognitive development as part of the Philadelphia Neurodevelopmental Cohort based at the University of Pennsylvania.
The researchers created growth charts that reflected the configuration of what are called intrinsic connectivity networks — important units of functional brain organization. The way these networks interact may hold the key to healthy attention.
For example, one called the default mode network seems to be involved in daydreaming and inwardly focused thought, whereas another set of networks are involved in cognitively demanding tasks.
As we grow from children into adults, these two systems become more defined and separate, working in tandem like pistons: when one is on, the other turns off. But in children and those with attention difficulties, the “pistons” often misfire: the default mode network turns on and interrupts the other networks thereby interrupting attention.
The researchers who gathered the data that the growth chart is based on measured attention functioning using a standard test in which children had to respond to a sequence of letters and numbers on a computer screen. The Michigan researchers then compared the brain development seen on the scans to attention functioning. It turned out they could actually predict how well a child would do on the attention test based on their place on (or off) the brain network growth chart. The children with ADHD symptoms, and those with the lowest performance for their age on the attention tests, were the furthest off the curve of brain network development.
“These brain network growth charts show real promise,” said Sripada. “But they are far away from being ready for clinical use.”
Future research paths
The research used advanced MRI imaging, but Sripada and his colleagues hope to develop ways to track network maturity using less-expensive techniques such as electroencephalography, or EEG.
They’re working with other U-M researchers, led by Mary Heitzeg, Ph.D., and Robert Zucker, Ph.D., to see if the growth charting method will be useful in the Adolescent Brain Cognitive Development study (ABCD for short) that will involve 10,000 teens over several years.
“The ABCD study is unprecedented in size and provides a real chance to develop definitive growth charts for brain networks,” explained Sripada. “We have the opportunity to understand how brain network development relates to a variety of outcomes, including cognition, emotion, personality, and behavior.”
Funding: The research was funded by the National Institutes of Health (AA020297 and MH107741) as well as the Center for Computational Medicine and the John Templeton Foundation.
Source: Kara Gavin – University of Michigan Health System
Image Source: The image in credited to Sripada lab, University of Michigan.
Original Research: Full open access research for “Growth Charting of Brain Connectivity Networks and the Identification of Attention Impairment in Youth” by Daniel Kessler, BS; Michael Angstadt, MAS; and Chandra Sripada, MD, PhD in JAMA Psychiatry. Published online April 13 2016 doi:10.1001/jamapsychiatry.2016.0088
Abstract
Growth Charting of Brain Connectivity Networks and the Identification of Attention Impairment in Youth
Importance Intrinsic connectivity networks (ICNs), important units of brain functional organization, demonstrate substantial maturation during youth. In addition, interrelationships between ICNs have been reliably implicated in attention performance. It is unknown whether alterations in ICN maturational profiles can reliably detect impaired attention functioning in youth.
Objective To use a network growth charting approach to investigate the association between alterations in ICN maturation and attention performance.
Design, Setting, and Participants Data were obtained from the publicly available Philadelphia Neurodevelopmental Cohort, a prospective, population-based sample of 9498 youths who underwent genomic testing, neurocognitive assessment, and neuroimaging. Data collection was conducted at an academic and children’s hospital health care network between November 1, 2009, and November 30, 2011, and data analysis was conducted between February 1, 2015, and January 15, 2016.
Main Outcomes and Measures Statistical associations between deviations from normative network growth were assessed as well as 2 main outcome measures: accuracy during the Penn Continuous Performance Test and diagnosis with attention-deficit/hyperactivity disorder.
Results Of the 9498 individuals identified, 1000 youths aged 8 to 22 years underwent brain imaging. A sample of 519 youths who met quality control criteria entered analysis, of whom 25 (4.8%) met criteria for attention-deficit/hyperactivity disorder. The mean (SD) age of the youth was 15.7 (3.1) years, and 223 (43.0%) were male. Participants’ patterns of deviations from normative maturational trajectories were indicative of sustained attention functioning (R2 = 24%; F6,512 = 26.89; P < 2.2 × 10⁻¹⁶). Moreover, these patterns were found to be a reliable biomarker of severe attention impairment (peak receiver operating characteristic curve measured by area under the curve, 79.3%). In particular, a down-shifted pattern of ICN maturation (shallow maturation), rather than a right-shifted pattern (lagged maturation), was implicated in reduced attention performance (Akaike information criterion relative likelihood, 3.22 × 1026). Finally, parallel associations between ICN dysmaturation and diagnosis of attention-deficit/hyperactivity disorder were identified.
Conclusions and Relevance Growth charting methods are widely used to assess the development of physical or other biometric characteristics, such as weight and head circumference. To date, this is the first demonstration that this method can be extended to development of functional brain networks to identify clinically relevant conditions, such as dysfunction of sustained attention.
“Growth Charting of Brain Connectivity Networks and the Identification of Attention Impairment in Youth” by Daniel Kessler, BS; Michael Angstadt, MAS; and Chandra Sripada, MD, PhD in JAMA Psychiatry. Published online April 13 2016 doi:10.1001/jamapsychiatry.2016.0088